One pain point and wish list item we kept hearing from our customers was the need for a chart option that easily displayed multiple charts and different types of charts overlayed in one place. This feature would allow users to more easily compare different data sets, which makes sense.
So in an effort to make Yurbi even more user-friendly, we listened! As of Yurbi v10.2, Combo Charts are now available for all Yurbi users. Now, you may be wondering, “What’s a Combo Chart?” We certainly don’t want to leave you in the dark, so here are three things you need to know about this new feature:
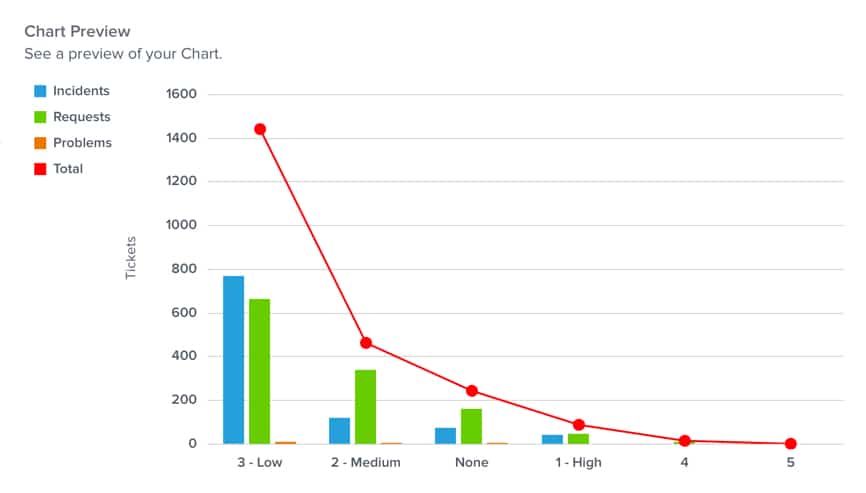
- Users can overlay one or more charts on top of another. This feature allows users to combine two or more sets of data on top of each other for easier data comparisons. In the current release you can overlay any combination of a bar, line, or area chart.
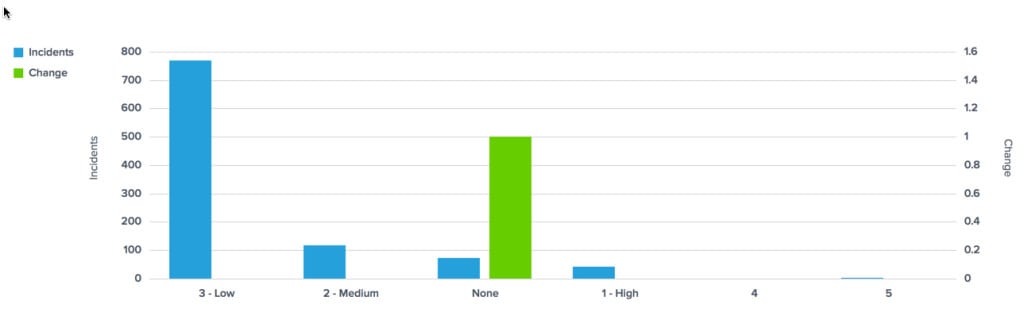
- Users can include dissimilar data in the same chart. Typically if a user has dissimilar data with points that don’t match up, it’s challenging to see both charts. For example, if a user wants to show one set of data that increases incrementally by .1 (e.g. .1, .2, .3) and another set of data that increases by 10 (e.g. 0, 10, 20), on a traditional chart the smaller values wouldn’t be visible and the larger values would be too visible. We solved this problem by letting you designate different Y-Axis values per data series in a Combo Chart. Plus you can have multiple right and left axes.
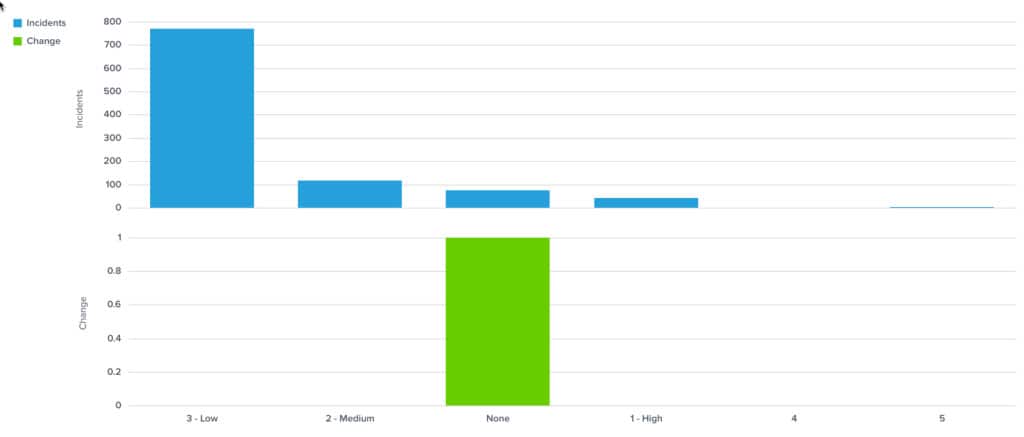
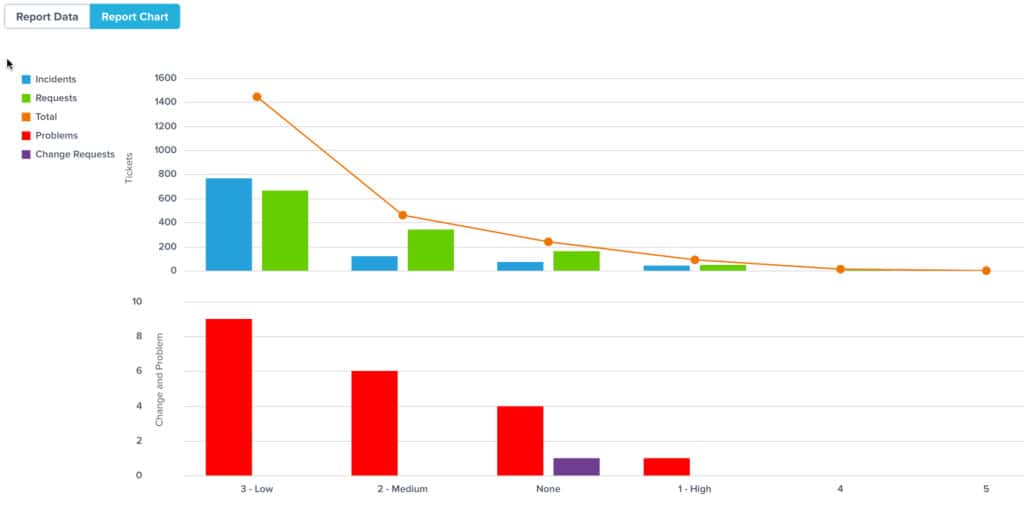
 We also provided another way to view such data by allowing users to build a top pane chart and a bottom pane chart so users can view dissimilar date on one chart – all without writing any code.
- Users can combine both new features. Not only can users overlay data sets and build charts with dissimilar data, but they can also do both at the same time for even more powerful, compelling data displays.
Stop rebuilding your reporting layer.
Embed Yurbi into your product and ship analytics to your customers in weeks — not quarters. Self-hosted, white-labeled, flat annual pricing.
Download Free Trial