At Yurbi, we have two goals with our product: To make our tools as personalized as possible and to ensure that Yurbi is easy for the business user to use on a day-to-day basis. This is why we updated our Chart Wizard to make it more customizable and easy to use.
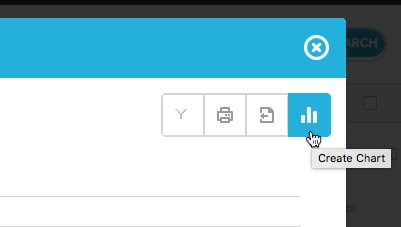
Previously users could click the Chart Wizard icon from Yurbi’s Report Details screen to modify an existing chart or create a new chart from a dataset if it included both numeric and text-based data.
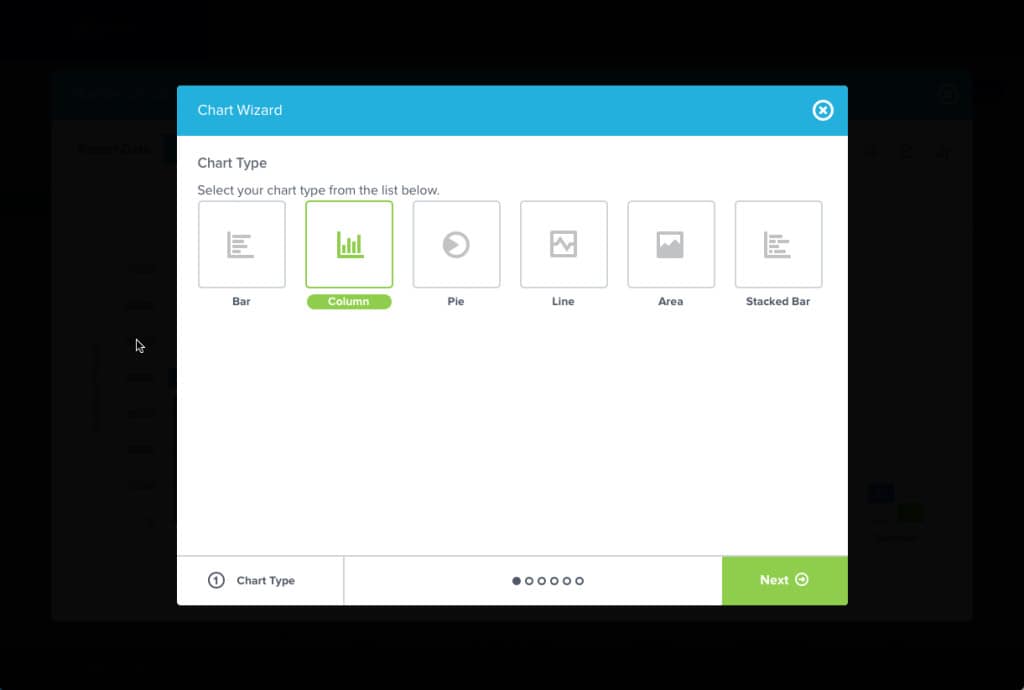
From the Chart Wizard, users were able to choose the basic type of chart they wanted to see, such as a line chart, a pie chart, a bar chart, and so on. Users could also tailor the different variables of the chart to meet their specific needs. This was a great feature that allowed users to personalize data and charts to fit their exact requirements. This feature then allowed users to export or print the chart exactly the way they wanted to see it from the Report Details screen
 These options are still available, but we have expanded the customization of user output types even further. Here’s what you need to know:
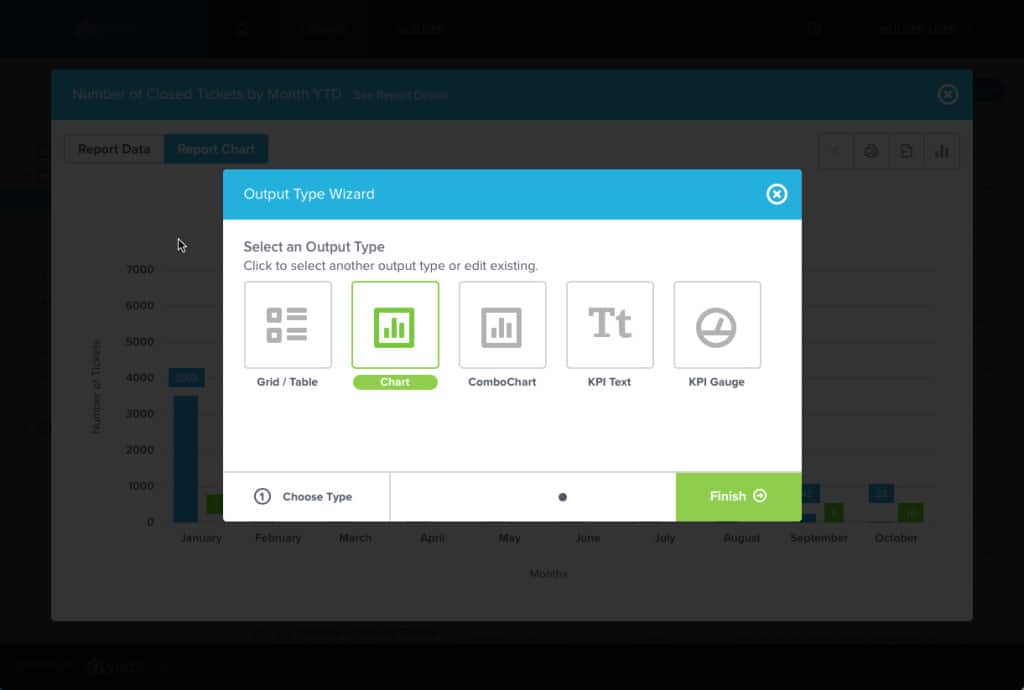
Yurbi now has additional report view options. In addition to dynamically changing a report to multiple types of charts, users can now personalize their view of a dataset to convert a report into a Grid/Table, a Combo Chart, KPI Text, or a KPI Gauge. Previously only a user with Yurbi Builder permissions were able to access these options, now all users can personalize their output type to the view they need (and still print or export the result!).
These options are still available, but we have expanded the customization of user output types even further. Here’s what you need to know:
Yurbi now has additional report view options. In addition to dynamically changing a report to multiple types of charts, users can now personalize their view of a dataset to convert a report into a Grid/Table, a Combo Chart, KPI Text, or a KPI Gauge. Previously only a user with Yurbi Builder permissions were able to access these options, now all users can personalize their output type to the view they need (and still print or export the result!).
What's next?
Our future plans include providing users the ability to save their custom report views as preferences. This will allow users to easily pull up their preferred output type of a report display by default. Similarly to the personalized preference options currently enabled within the Dashboard Widgets, customizing your own report view won’t affect other report views within your organization. We also have plans to expand the report output types available, including the inclusion of Map Overlays and Heat Maps. We hope these additional report view options enable users to choose the most compelling and impactful displays for the data they are presenting. These new features save users time, increase the personalization of Yurbi’s charts feature, and make the display options even easier to use. Want to learn more about this new feature? Contact our support team for more information.Stop rebuilding your reporting layer.
Embed Yurbi into your product and ship analytics to your customers in weeks — not quarters. Self-hosted, white-labeled, flat annual pricing.
Download Free Trial